Welcome to the spatial module of the Land-use Planner
The objective of this module is to spatialise certain results of the Land-use Planner , in particular deforestation dynamics. Visualising these dynamics of change on a map raises awareness of the impact of certain decisions during land-use planning processes. The Land-use Planner Spatial consists of three steps and produces an animated map that illustrates the evolution of deforestation over the chosen simulation period.
- Step 1 : delimitation of the studied area
- Step 2 : input of annual deforested surfaces by forest type according to the results of a Land-use Planner scenario
- Step 3 : visualisation of the animated map
Note: The accuracy and spatial relevance of the final maps remain limited given the generic nature of the method used and the limitations of the databases available at the continental scale. The results are particularly of interest for facilitating dialogue among stakeholders and raising awareness of certain potential impacts. For any other use, they should be taken lightly and should be supplemented by more in-depth processing. In particular, there may be discrepancies between the deforestation values entered in step 2 of the Land-use Planner Spatial and the values in the results due to the limited resolution of the spatial data.
User manual
Welcome to the spatial module of the Land-use Planner!
The objective of this module is to spatialise certain results of the Land-use Planner, in particular deforestation dynamics – and soon also the restoration of forest landscapes. Visualising these dynamics of change on a map raises awareness of the impact of certain decisions during land-use planning processes. The Land-use Planner Spatial consists of three steps and produces an animated map that illustrates the evolution of deforestation over the chosen simulation period.
- Step 1 : delimitation of the studied area
- Step 2 : input of annual deforested surfaces by forest type according to the results of a Land-use Planner scenario
- Step 3 : visualisation of the animated map
Note: The accuracy and spatial relevance of the final maps remain limited given the generic nature of the method used and the limitations of the databases available at the continental scale. The results are particularly of interest for facilitating dialogue between stakeholders and raising awareness of certain potential impacts; for any other use, they should be taken with caution and should be supplemented by more in-depth processing. In particular, there may be discrepancies between the deforestation values entered in step 2 of the Land-use Planner Spatial and the values in the results due to the limited resolution of the spatial data.
1. Area
The Land-use Planner Spatial area must correspond as closely as possible to the area used in the Land-use Planner tool. Check that the surface displayed here (in hectares) matches the one used in your Land-use Planner scenarios.
Two options are available to delimit the area in the Land-use Planner Spatial:
- Loading delimitation data in Key Markup Language (KML, Google Earth format), or
- Manual delimitation on the online map using the editing tools (rectangular area or creation of a specific polygon)
For each territorial delimitation, the Land-use Planner Spatial calculates and indicates the total surface of the area as well as the surface of each land use by crossing them with the forest statuses. Do not hesitate to adjust your delimitations if it doesn’t accurately correspond to the area used in your Land-use Planner project.
You must also enter the name of your area so that it appears in the final presentation.
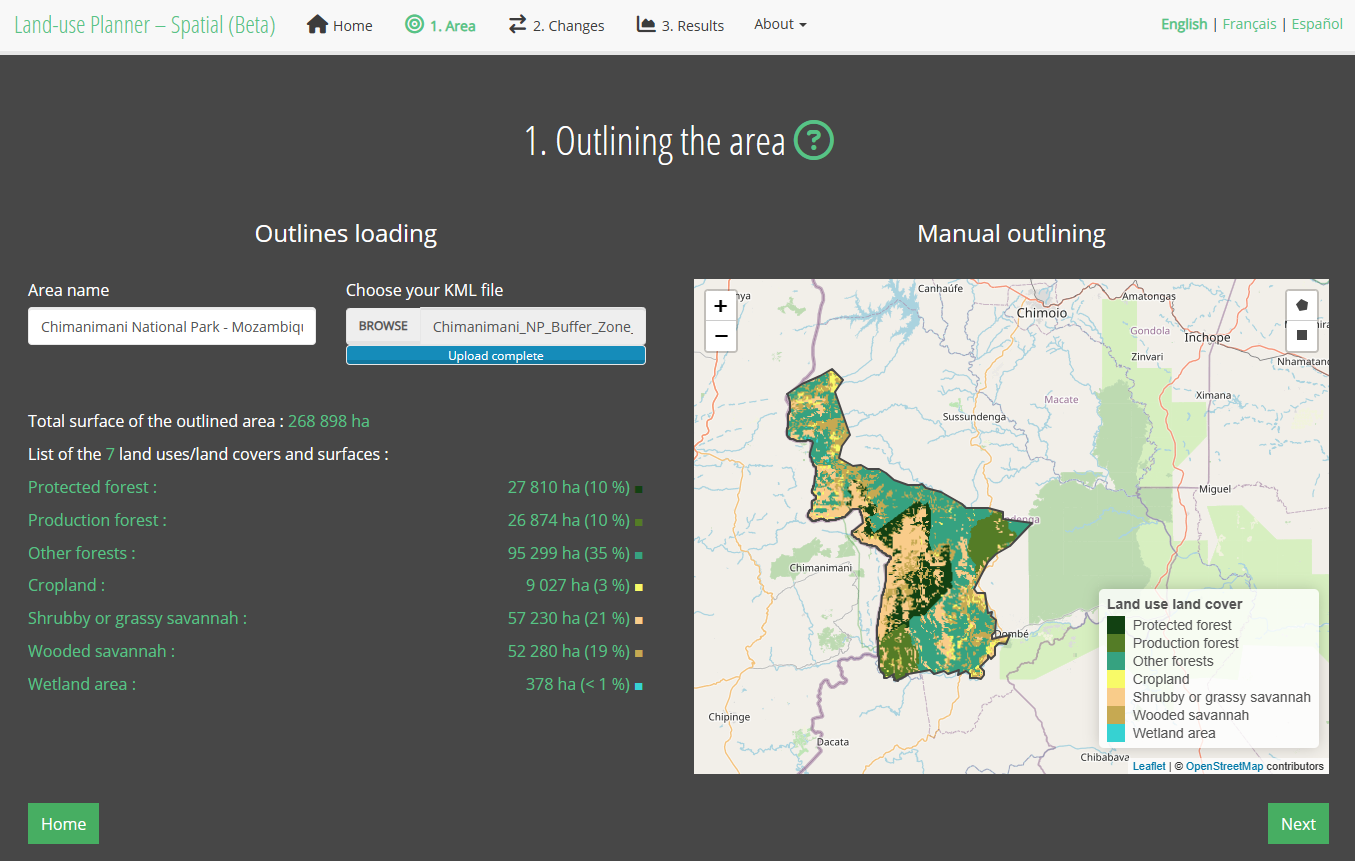
Figure 1 : Screenshot of step 1, delimitation of the area
2. Changes
The information about land-use changes and deforestation comes from Land-use Planner results and should be integrated at this stage. In your Land-use Planner project, choose the scenario that interests you to map deforestation dynamics with the Land-use Planner Spatial. Useful information can be found in the results table of the Land-use Planner matrix (“Raw_matrix.xls”) which summarises the surfaces of land use conversion by year for a given scenario. These Land-use Planner results can be integrated into Land-use Planner Spatial by loading a table summarising only the deforestation conversions by year for each of the three forest types in Land-use Planner Spatial: protected forests, production forests and other forests. The user can also manually set each surface value (in hectares) in Land-use Planner Spatial by entering the corresponding values in the table on the right. The underlying work of integrating Land-use Planner data into the Land-use Planner Spatial table of changes is summarised below.
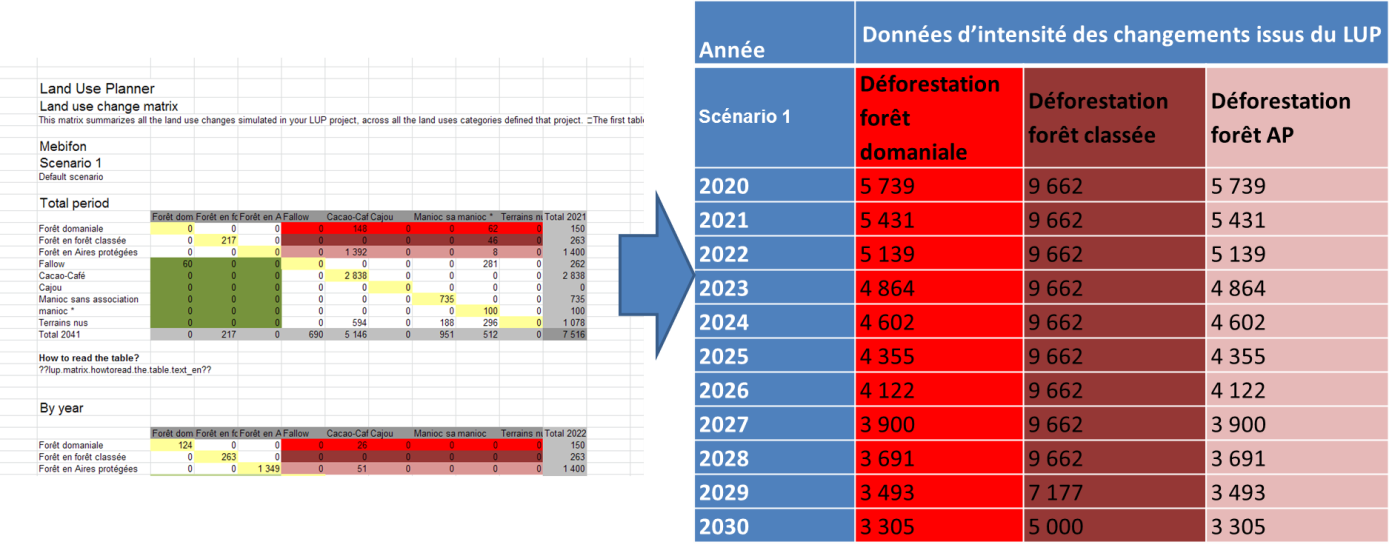
Figure 2 : Illustration of the link between the raw results from the Land-use Planner (Land-use Planner matrix for a given scenario) and the aggregation of data according to the three forest types in the Land-use Planner Spatial for integration into the spatial module. The Land-use Planner Spatial table of changes shows the intensity of annual changes in hectares in rows for each of the three forest types in columns: deforestation of protected forests, production forests or other forest types.
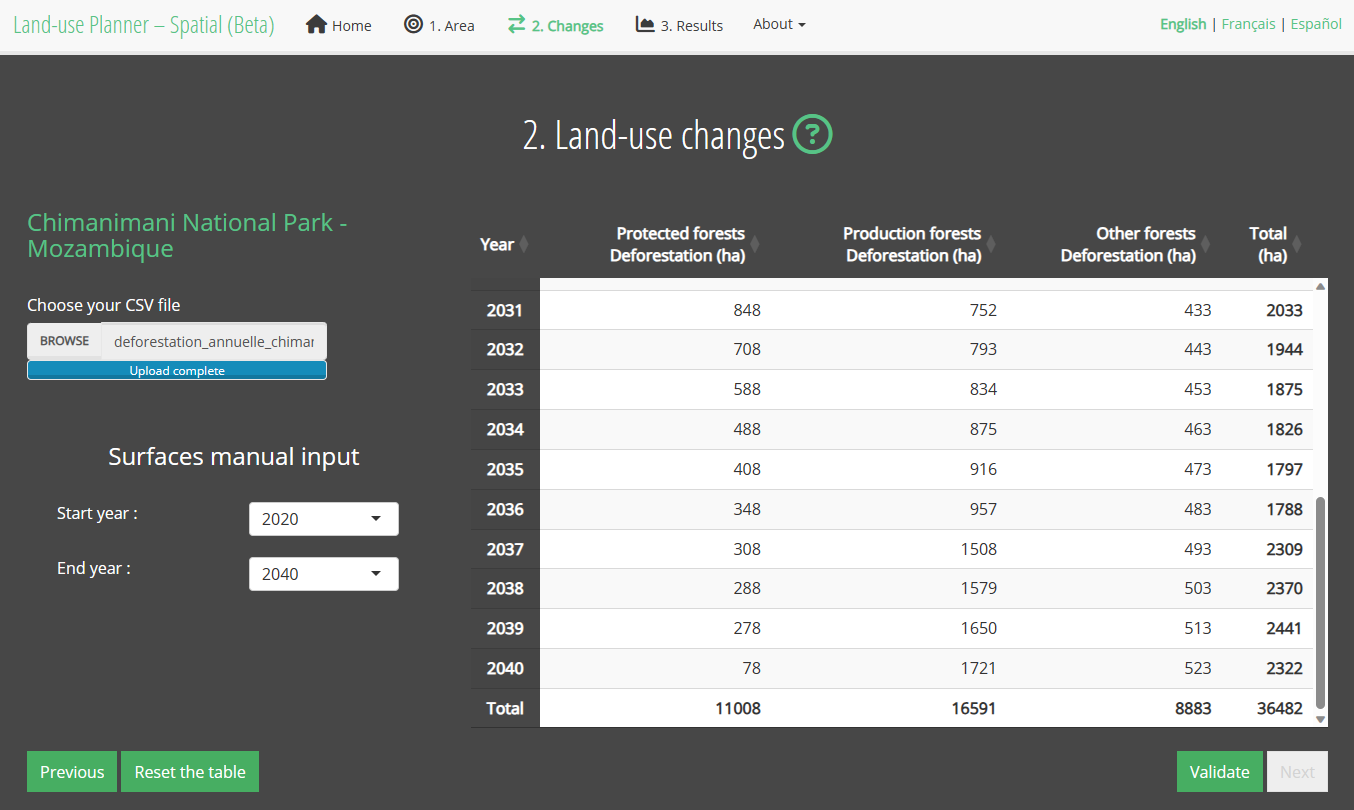
Figure 3 : Screenshot of step 2, changes in land use
The factors of change taken into account are:
- Distance into the forests from the edge
- Distance to markets estimated by distance to major cities
- Accessibility of the resource estimated by distance to road infrastructure
The distance is calculated in metres “as the crow flies” (Euclidean distance). These three factors are simply added together into a single distance factor (uniform weighting).
Currently, the user cannot modify the choice and weighting of the factors of change.
3. Results
The results are calculated based on: (1) the land-use map integrating the forest land tenure status, (2) your table of changes, and (3) the probability of change map. The annual changes are subtracted from the initial surfaces of each type of forest by taking the pixels with the highest probability of being converted, according to the probability of change map based on the three factors mentioned above. The converted surfaces correspond exactly to the values in the table of changes indicated by the user except when the forest surfaces are insufficient – forest type(s) completely disappeared.
The main result is displayed as an animated map showing the forest surfaces lost by year (GIF). Additional graphs show the annual surfaces cleared and the cumulative total of those surfaces by forest type over the simulation period.
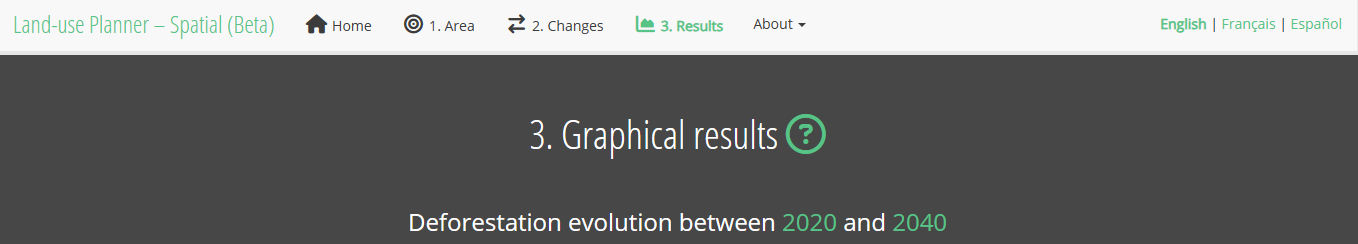

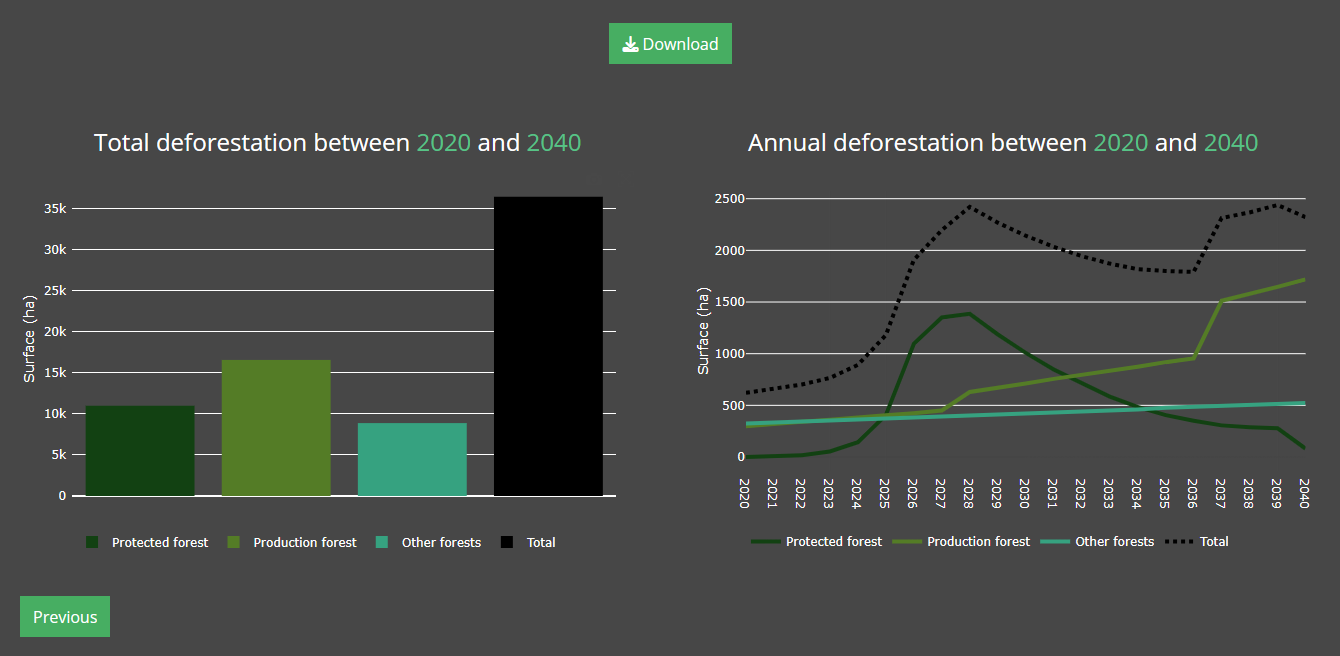
Figure 4 : Screenshot of step 3, visualisation of the animated map and summary graphs
Methodology
This page presents the data and methodological elements needed to understand the spatial module of the Land-use Planner, referred to below as Land-use Planner Spatial, and guide the user.
The objective of this first phase of development (prototype version) is to demonstrate the feasibility of the dynamic mapping of deforestation on the scale of the African continent based on results from the Land-use Planner. A future development phase of this module could visualise the restoration of forest landscapes, allow the modification of change factors, and cover other continents and other conversion factors. For this first phase, we made these technical choices:
- Geographical limitation to the African continent
- Limiting the dynamics of land-use change to deforestation, namely conversion from forest to other uses
- The forests concerned are dense rainforests and dense dry forests
- A limited number of factors to locate deforestation dynamics (distance from the forest edge, and to markets and road infrastructure)
- A limited user interface (for example, the user does not have control over the choice and weighting of factors for locating deforestation)
The module is structured around three steps ( 1. Area, 2. Changes, Results ). The different steps trigger geoprocessing and cross-referencing between the user data and pre-compiled map data on the server side ( see the preparation of input data ) and return the results of those calculations to the user side, which can be viewed in the application. The graphic below shows the architecture of the module and the operating principles on the user and server sides.
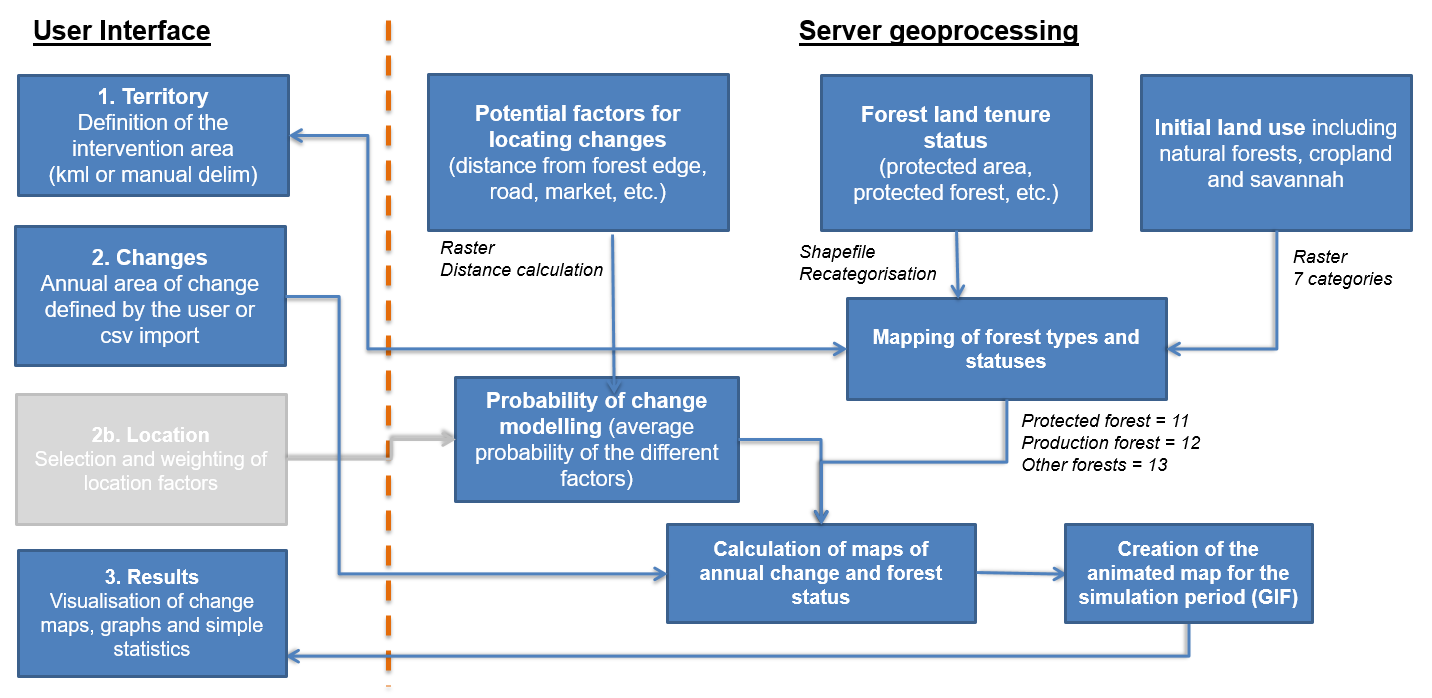
Figure 1 : Diagram showing the general methodology of the Land-use Planner Spatial. The greyed interface is an option for a future development phase.
In the preparation phase, certain data can be pre-compiled so that the application can process them directly and quickly. This work is carried out upstream using raster or vector primary data, with different resolutions and dates ( see the table of primary data ). The various processing operations carried out using this data are described in greater detail below.
Table 1: Used spatial databases
* N/A = information not available
** indicates that only spatial information (boundaries, contours, linear, location) was used.
1. Categorisation of the land cover map
The module uses the land cover map produced by the European Space Agency (ESA product LC CCI) for 2020. This map offers global mapping of land cover in 38 categories, at a resolution of 300 metres, and has been updated annually since 2005. Not all the categories are present in the territory of Africa. For greater clarity and in alignment with the Intergovernmental Panel on Climate Change’s typology, this key was initially simplified into seven categories, based on the ESA typology, then into 10 categories after integration of the forest land tenure statuses ( see the identification of land tenure statuses ).
Table 2: Nomenclature of the 10 land-use categories of the land cover map after recategorisation of the ESA-CCI map
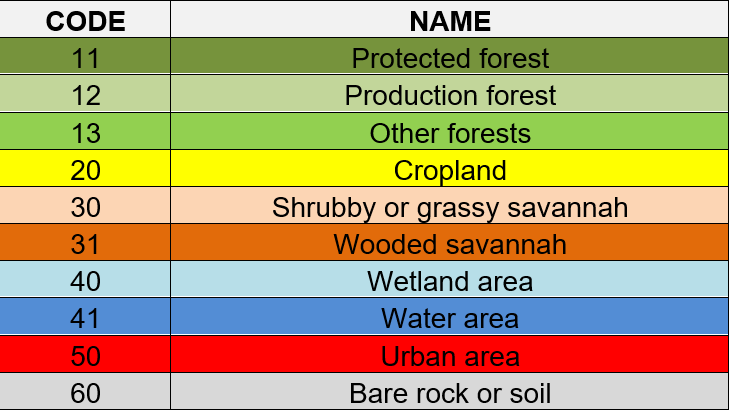
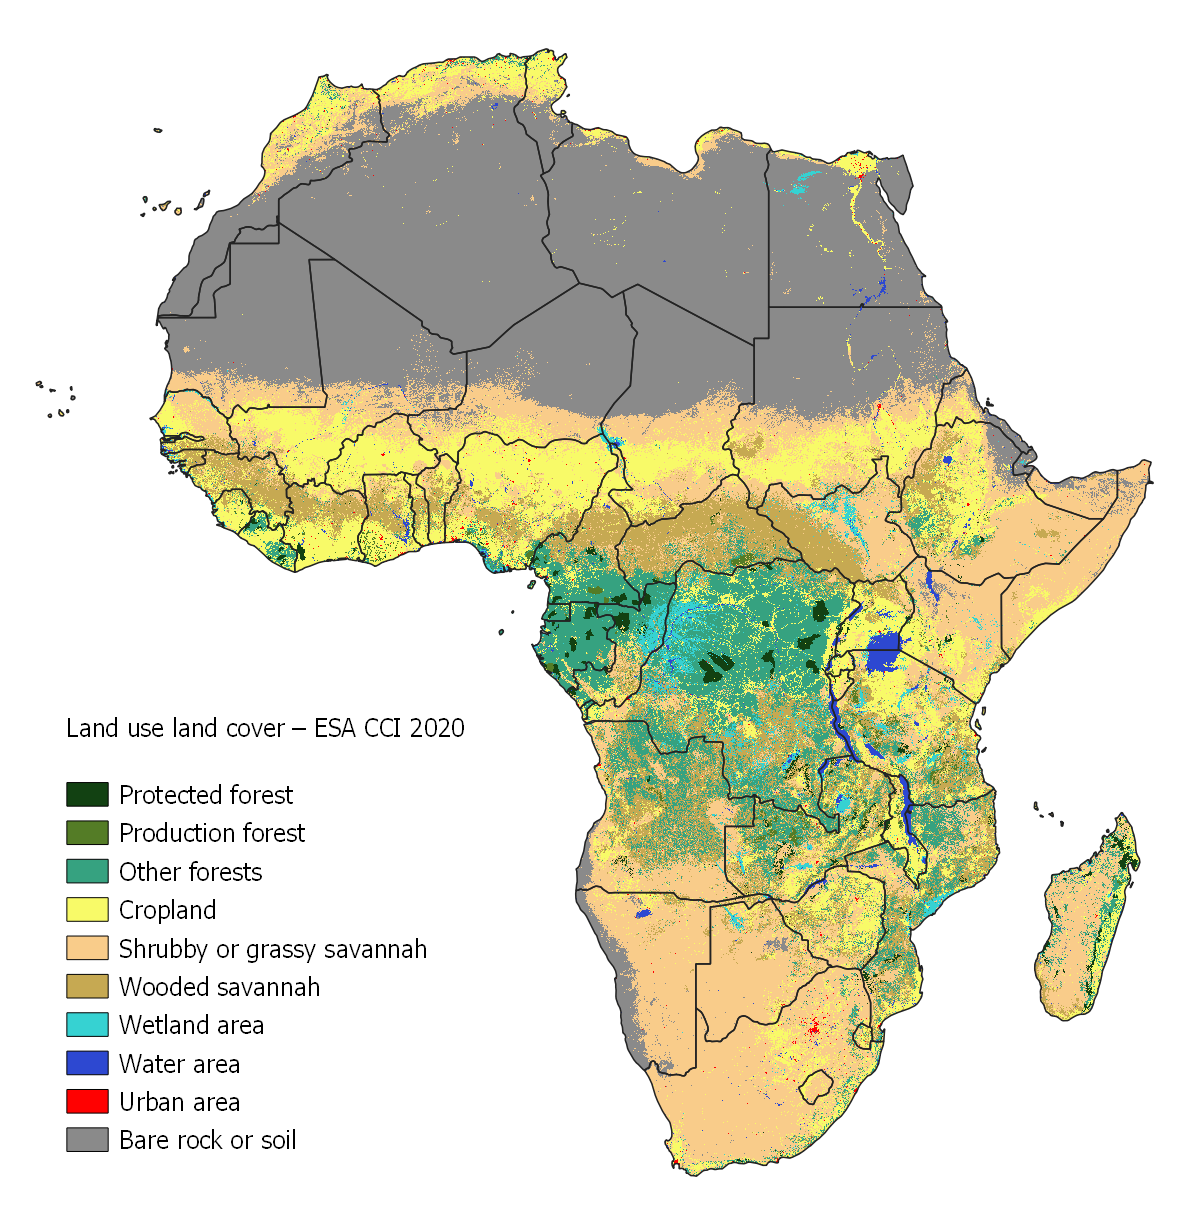
Figure 2 : The land-use map used in the Land-use Planner Spatial, recategorised based on the 2020 ESA CCI map and cross-referenced with the land tenure statuses from the WDPA database
2. Identification of forest land tenure statuses
Using the World Database on Protected Areas (WDPA), forest uses have been categorised into three types: protected forest, production forest and other forests. This categorisation is based on information from the database, in particular the name of the protected area (“DESIG_EN” column) and the IUCN category (“IUCN_cat” column). The following decision tree was applied to categorise the three forest types.
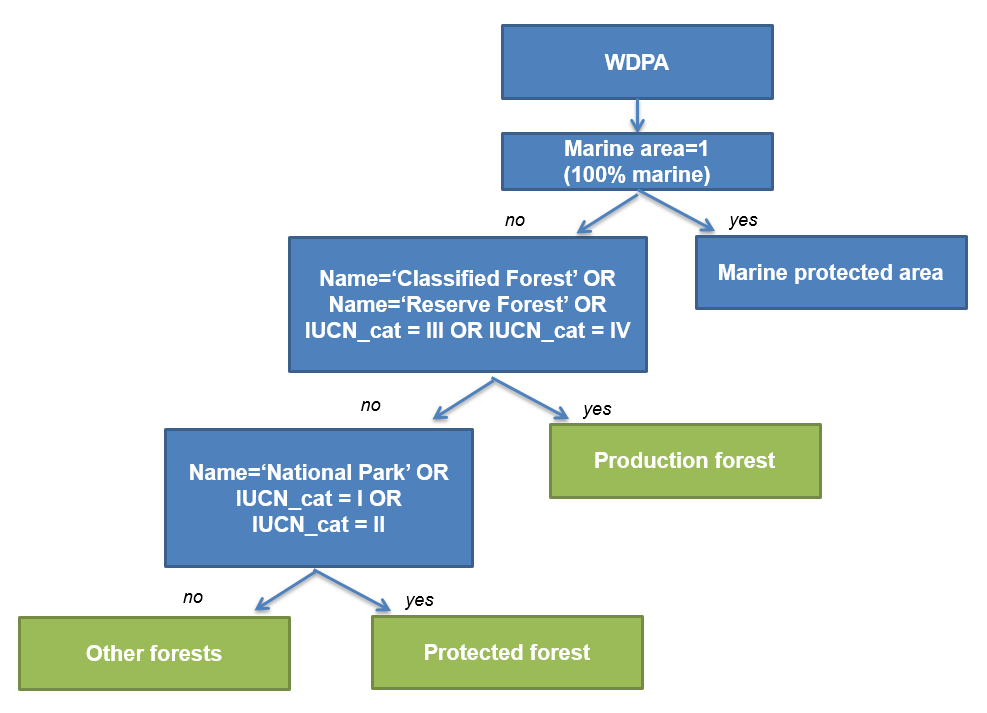
Figure 3 : Decision tree for the categorisation of the three forest types used in the Land-use Planner Spatial. The information from the WDPA database is used to filter and label the typology (green squares) as presented in the blue squares. Note that the first criterion means that only marine areas entirely located in marine zones are excluded, while those entirely or partly on land are maintained.
The WDPA database is continuously updated with the knowledge available and data sent by States. Despite the data providers’ quality control efforts, it is important to note this database’s limitations: the data is incomplete; there are categorisation errors; different countries use different systems; and the status of protected areas can evolve, generating duplicates. For instance, based on the version used (November 2022), we have observed that:
- About 40% of protected areas (more than 8,000 in Africa) have not been assigned IUCN categories
- Some National Parks are categorised as type V (protected landscape or seascape) or VI (protected area with sustainable use of natural resources)
- “Classified Forests” in Ivory Coast correspond to “Forest Reserves” in Ghana
- Comoé National Park in Ivory Coast is characterised by two polygons with different information that overlap and correspond to the former statuses and boundaries.
- Mabi-Yaya National Reserve in Ivory Coast appears as a Classified Forest although it was upgraded to a National Reserve in 2019
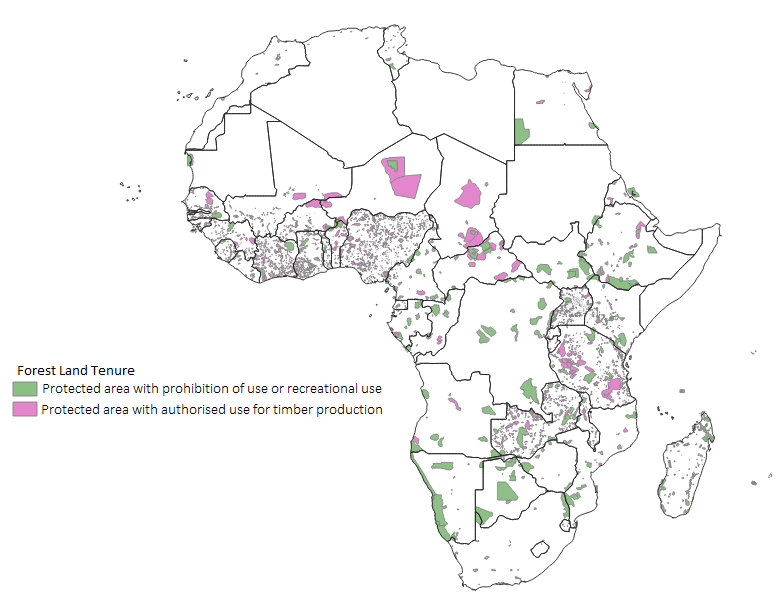
Figure 4 : Mapping of forest land tenure statuses based on the WDPA database recategorisation
3. Factors of change
Factors of change reflect risks or favourable areas of change in terms of probability. With regard to deforestation, various spatial factors enable locating probable deforestation. The most common factors have been integrated into the module. First, there is a factor of accessibility to the resource, estimated by the distance from the edge of the forest. Then, two socioeconomic factors were included in the risk map: proximity to major agricultural markets and distance to road infrastructure. These two factors are commonly used in spatial or econometric modelling studies of deforestation. They reflect demand for food, access to the resource and, indirectly, population density. These three factors have been combined by adding the values of the raw data (distance in metres) with a uniform weighting of the three factors in the representation of risk.
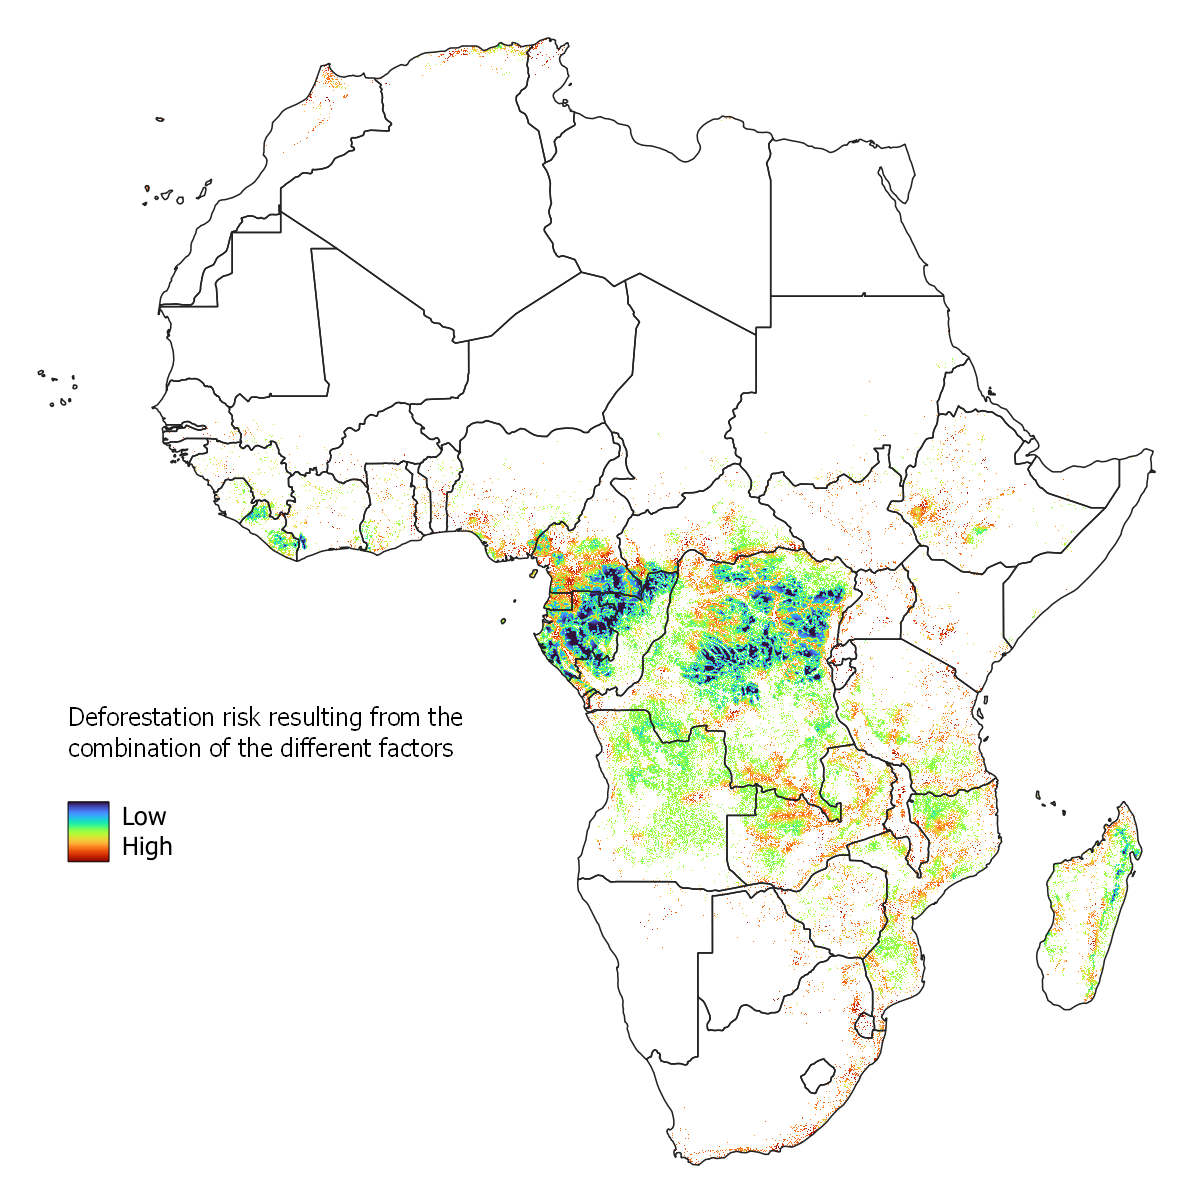
Figure 5 : Illustration of the deforestation risk map crossing the factors of distance from the forest edge, and to road infrastructure and major agricultural markets. The areas in red are the areas with the highest risk. Yellow and blue areas, located far from roads and towns and/or within large forested areas, are less likely to be cleared
Credits
The spatial module of the Land-use Planner was developed by the European Forest Institute and Nitidae .


It was wholly developed within the R software via its R Studio user interface using the R Shiny package. Some key features, such as map visualisation and interactivity of the figures are provided by the open-source technologies Leaflet and Plotly , respectively. The server deployment was carried out with the Docker technology.

Legal notice
This module was produced with the assistance of the European Union. The content of this module is the sole responsibility of the European Forest Institute and can in no way be considered to reflect the views of the funding bodies.
Unless otherwise specified, the content of this page is protected by a Creative Commons CC BY-NC-ND license.
